Kitchener's industrial expansion from a Mennonite farming settlement into a major tech and manufacturing hub placed heavy demands on its soils. The city sits on the Waterloo Moraine, a complex mix of glacial till, silt, and clay deposited during the last retreat of the Laurentide Ice Sheet. This means the near-surface geology varies dramatically over short distances. An excavation at Victoria Street can hit dense sandy till, while a borehole near the Grand River wetlands encounters highly plastic clay. For any project involving cut-and-fill or shallow footings, understanding the fine-grained fraction is non-negotiable. We run Atterberg limits according to ASTM D4318 to give you the liquid limit, plastic limit, and plasticity index. These numbers define how the soil will behave when it gets wet, which happens often in a city that averages 916 mm of annual precipitation.
A plasticity index above 25 in Kitchener tills demands careful moisture control during compaction and often triggers a requirement for engineered fill replacement.
Methodology and scope
Site-specific factors
The single most expensive mistake we see on Kitchener sites is mixing Atterberg limits with grain-size distribution and thinking a simple grain-size curve is enough. It is not. A silt with a PI of 4 and a fat clay with a PI of 35 can have similar-looking gradations but behave completely differently under load and when exposed to water. Contractors who skip the plastic limit test risk placing structural fill that seems stable during dry summer construction but turns into a deformable mess after spring thaw. The Ontario Building Code references foundation design requirements that depend directly on soil plasticity. Ignoring the PI when designing basement walls or slab-on-grade floors in Kitchener's clay-rich zones leads to cracking, differential heave, and costly underpinning work years later.
Reference standards
ASTM D4318-17e1 (Standard Test Methods for Liquid Limit, Plastic Limit, and Plasticity Index of Soils), Ontario Building Code (O.Reg. 332/12, as amended), CSA A23.3 (with geotechnical input for foundation subgrade)
Associated technical services
Grain-Size Analysis (Hydrometer)
We pair the hydrometer test with Atterberg limits to cover the full range from clay to sand. Knowing the clay fraction below 2 microns explains the measured plasticity and helps refine the USCS classification for cohesive soil layers.
Shrink-Swell Potential Assessment
Using the plasticity index and clay content, we evaluate the volume change potential of Kitchener clays. This assessment directly informs foundation design, including the need for rigid pavements, moisture barriers, or over-excavation and replacement.
Typical parameters
Frequently asked questions
How much does Atterberg limits testing cost in Kitchener?
Atterberg limits testing typically runs between CA$90 and CA$150 per sample, depending on whether you need just the liquid and plastic limits or the full set with natural water content and liquidity index calculation. For multi-sample projects across a Kitchener site, we can structure the pricing to fit your exploration budget. The cost is trivial compared to repairing foundation distress caused by uncharacterized plastic clay.
What is the difference between liquid limit and plastic limit?
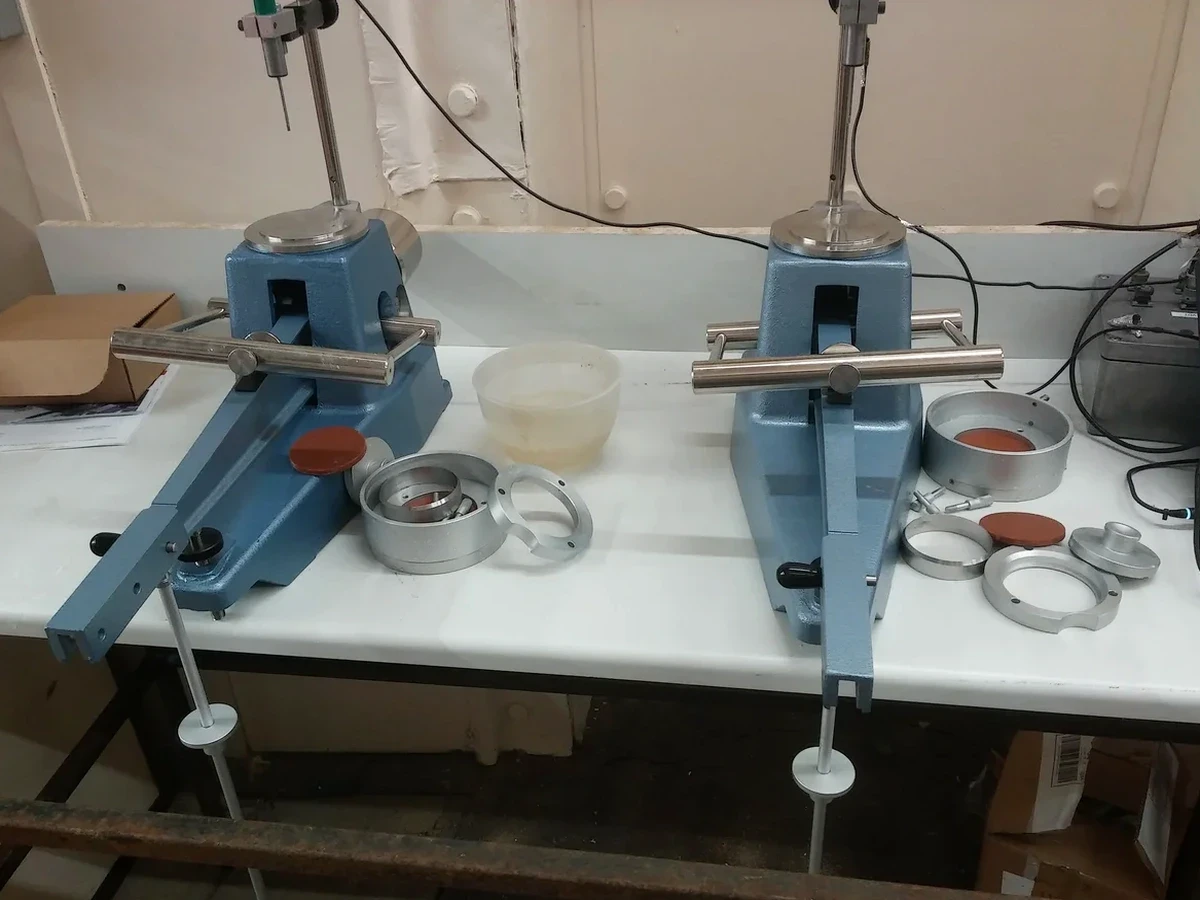
The liquid limit is the water content at which soil transitions from a plastic to a liquid state, measured with the Casagrande cup. The plastic limit is the water content at which the soil stops behaving plastically and starts crumbling when rolled into a 3 mm thread. The difference between the two is the plasticity index, which tells you the range of moisture over which the soil remains plastic and workable.
How long does it take to get results from your Kitchener lab?
Standard turnaround is 3 to 5 business days from sample delivery. The test requires air-drying the material, sieving through the No. 40 mesh, and then performing the liquid and plastic limit procedures with proper calibration of the Casagrande cup. We can expedite results when the project schedule demands it, provided we receive prior notice.